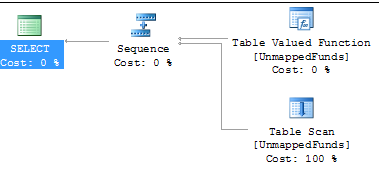
T-SQL manages the execution plan of non-inline table-valued functions separately from the code that calls the function. It treats it like a black box, which is why you see the UDF in the query plan instead of the UDF’s contents. This probably is related to the fact that non-inline table-valued functions can have multiple statements and a query plan is only capable of showing a single statement(?) (or at least it looks that way).
Mikael Eriksson commented:
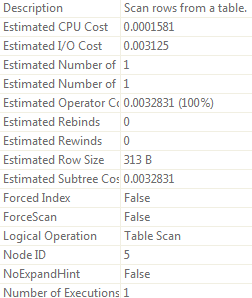
You have a multi statement table valued function and SQL Server can not look into that and show the execution plan for the function. The scan you see here is a scan of the rows returned by the function and since you have no where clause, a scan is the best thing to do.
...and linked to this pastebin showing how to see the cached query plan of the non-inline table-valued function.
If you have executed your function at least once (e.g., SELECT * FROM myUdf()), then it should be cached in SQL Server. To show that cached plan, take the name of your function minus any schema and plug it into the query below (quoted from Mikael's code):
select
  PlanCreated       = qs.creation_time,
  ObjectName        = object_name(st.objectid),
  QueryPlan         = cast(qp.query_plan as xml),
  QueryText         = substring(st.text, 1 + (qs.statement_start_offset / 2), 1 + ((isnull(nullif(qs.statement_end_offset, -1), datalength(st.text)) - qs.statement_start_offset) / 2))
from sys.dm_exec_query_stats as qs
  cross apply sys.dm_exec_sql_text(qs.sql_handle) as st
  cross apply sys.dm_exec_text_query_plan(qs.plan_handle, qs.statement_start_offset, qs.statement_end_offset) as qp
where object_name(st.objectid) = 'FunctionName'
In the result set, the QueryText column should show a statement from the function and the QueryPlan should contain an XML query plan. In SSMS, if you click on a QueryPlan cell, it will automatically open up a new query plan viewer window. You will need to look at the source of your function and cross reference it to the statements and click through the query plans to search for performance issues.


