0

Given:

  • Production environment
  • Application Servers using Hibernate
  • SQL Server Studio Manager v17.5
  • SQL Server 2016 in a clustered HAG setup
  • SQL Servers do NOT have the Query Store feature enabled
  • The author of this question is a software engineer with enough SQL Server knowledge to be categorized as mostly harmless

update 1

  • Database growth settings: Unlimited, 1024000 KB, data only
  • instant_file_initialization_enabled - Yes
  • is_auto_update_stats_async_on - No

update 2

  • The server has 4 CPU cores
  • There are spikes of waiting tasks of over 3,000,000. I have no idea yet what they are. This must be the reason for the large 'lock' times.
  • These spikes occur every 10 or 15 seconds. I have the following graph updating once a second:

enter image description here

The problem:

The root problem is that at seemingly random times of a busy day a couple of SQL queries timeout, however, for the purposes of this question I am interested in whether the screen grab is indicative of a problem in itself. Perhaps this is to subjective, but I have no experience with this value.

Action:

The failures themselves do not point directly to a concrete issue and therefore I am currently gathering evidence and attempting a process of elimination where possible. Currently I am investigating whether excessive wait times and a 'perfect storm' of queries could cause a cascade of locks and thus a query timeout.

Evidence Gathered:

  • Several queries are resulting in either full index scans or full table scans.
  • Several screen grabs with execution plans showing table scans. Cursory inspection shows that indexes do exist - yet not used. I might be able to sanitize the screen grabs if they will prove useful.
  • The screen grab below showing a large wait time.

Question:

What other information would help determine if locking and wait times might be the cause of the query timeouts? For example, I have the following screen grab from sql server studio manager activity monitor. The value looked surprising to me.

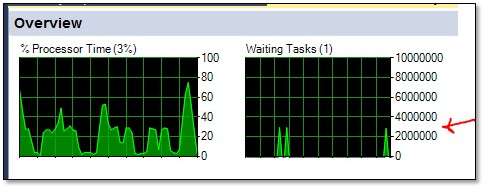
SQL Server Studio Manager Activity Monitor

7
  • 1
    You need to setup a trace or an Extended Events session and capture which locks are blocking. It could be a single query blocking everything, it could be lots of the same query, it could be an index rebuild. Do you have these on or off: asynchronous statistics update, instant file initialization? What is the autogrowth setting? Commented Mar 16, 2021 at 20:39
  • Thanks. That took a lot longer than I thought it would. Also, given that I'm in a production environment, I won't be able to turn tracing on or extended events (at least I doubt I'll get authorization).
    – D-K
    Commented Mar 16, 2021 at 21:26
  • You know.. the longer I look at activity monitor - the more I am beginning to believe that the queries themselves are simply timing out because they are taking to long. Not because of some perfect storm of waits and locks. Where or who might be setting a lower timeout value...
    – D-K
    Commented Mar 16, 2021 at 21:34
  • Timeout is a client-side thing. SQL Server doesn’t cancel long-running queries. Commented Mar 16, 2021 at 21:37
  • 1
    Regarding the full scans, I recall ORMs like Hibernate may use nvarchar parameters/literals when comparing varchar columns, precluding efficient index use with legacy SQL collations. That's the first thing I would check and change the ORM config if needed.
    – Dan Guzman
    Commented Mar 17, 2021 at 2:15

1 Answer 1

1

So the elephant in the room. Is that wait time excessive?

The lock waits from the screenshot show 18,024,389 ms / sec as the recent (average) wait time over the last couple of minutes. That means for every second of "wall clock time," there are 18,000 seconds (5 hours?!) of lock waits accumulated by queries. That's so tremendously bad that I wonder if it's just a bug in the Activity Monitor UI.

Depending on how many cores the server has, and how many queries are running concurrently, even the smaller number (2.5 seconds of lock waits per second of wall clock time) is not ideal.

Those waits could imply a blocking chain (you can use sp_WhoIsActive to identify the lead blocker and then try to fix why it's blocking everything). Regardless, they can definitely contribute to these client side timeouts you've described - every second that a query waits on locks is a second that it's not making progress on the actual query being run.

4
  • Josh, thanks. Perhaps what I am seeing in the "waiting tasks" section of the activity monitor is what is skewing the lock value. See my updated information. How can I determine what this / these queries are? Perhaps they aren't a problem but I'd like to learn what they are so I can eliminate them as the source or contributor to the problem..
    – D-K
    Commented Mar 17, 2021 at 18:17
  • @D-K That's wild. I'm trying to imagine what results in 3,000,000 waiting tasks on a 4 core server. Do you have permission to install (create) diagnostic stored procedures on this server? You could run sp_WhoIsActive during one of these spikes to see what queries are running, what they are waiting on, etc. Commented Mar 17, 2021 at 19:46
  • 1
    It is almost impossible to run that sp at the moment it happens. It finishes quickly. I say that, because I have yet to see a query in the 'active' portion of the activity monitor that matches these spikes. Given that this is a wildfly app server with hibernate - I'm now trying to rule out some sort of property bean lookup that's gone mad.... At this point, I think I'm going to have to profile and capture everything that happens for a period of time.
    – D-K
    Commented Mar 17, 2021 at 21:23
  • FYI. It turned out that the spike was related to a trigger. We still have not figured out how the trigger is becoming additive. No real pressure to figure that problem out - yet.
    – D-K
    Commented Jun 23, 2021 at 18:27

Your Answer

By clicking “Post Your Answer”, you agree to our terms of service and acknowledge you have read our privacy policy.

Not the answer you're looking for? Browse other questions tagged or ask your own question.