0

I have an RDS Postgres instance on a t3.small and am trying to drive down the CPU usage of my clients connecting to it (I have a few API services connected).

I've stopped all my services connecting to my DB to see how low the CPU usage will go and it does not go below 5% CPU Utilization, even after a reboot (see attached image, right at the end is where I stopped my services and rebooted the DB server).

I have ran SELECT * FROM pg_stat_activity and can confirm that there are no clients connected, but there are the usual AWS monitors and other wait_event_type=Activity rows.

Does RDS have a number of background services that will keep the CPU Utilization hovering around 5%?

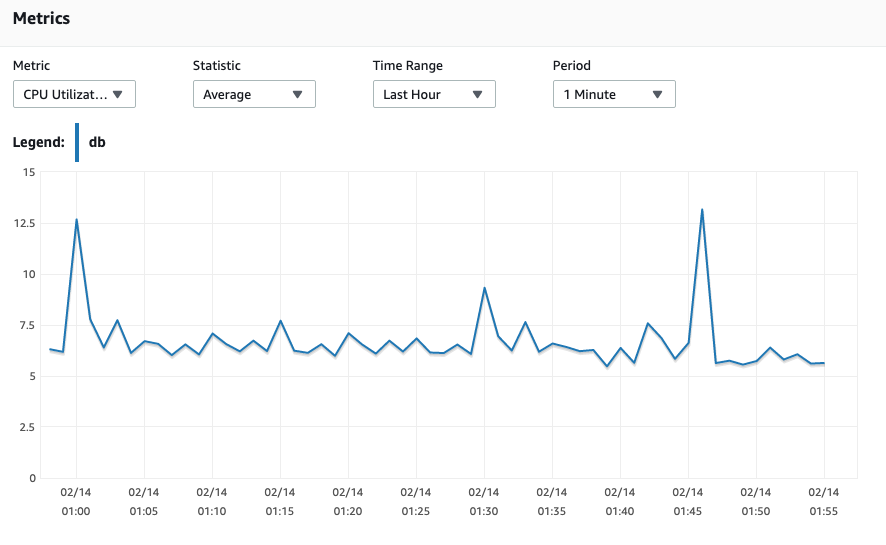
enter image description here

2
  • 2
    Only Amazon can tell you what their machines are doing when it is not you who causes the load. Commented Feb 14, 2023 at 8:20
  • If there is any hope of answering this question from outside, is reposes in the pg_stat_activity rows you have not shown us.
    – jjanes
    Commented Feb 14, 2023 at 15:58

1 Answer 1

0

AWS RDS provides Enhanced Monitoring which will collect additional data from the host. When this is enabled, you can view process list by navigating to the database instance in the console clicking the Monitoring tab, and changing the drop down on the right to OS process list.

Additional information can be found in the AWS documentation https://docs.aws.amazon.com/AmazonRDS/latest/UserGuide/USER_Monitoring.OS.Viewing.html

The documentation contains screenshots including the process list table.

Keep in mind, Enhanced Monitoring exports data as CloudWatch log lines so incurs an additional cost.

Your Answer

By clicking “Post Your Answer”, you agree to our terms of service and acknowledge you have read our privacy policy.

Not the answer you're looking for? Browse other questions tagged or ask your own question.